Buildings and climate changes
|
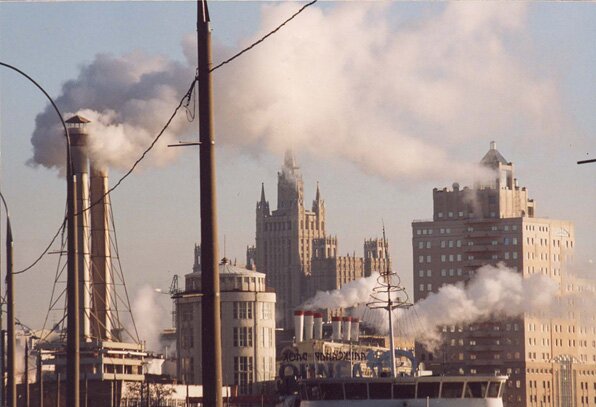
Photo V.Orlov.
|
| Warming of the climate system is unequivocal, as is now evident from observations of increases in global average air and ocean temperatures, widespread melting of snow and ice and rising global average sea level. A building is directly responsible for the generation of CO2 by its operation, construction, water use, and waste generation. Pablo La Roche PhD, Associate Professor of Architecture, Cal Poly Pomona University.
|
|
Warming of the climate system is unequivocal, as is now evident from observations of increases in global average air and ocean temperatures, widespread melting of snow and ice and rising global average sea level (1). This warming is caused by an increase in the concentration of green house gas emissions due to human activities and is the most pressing environmental challenge facing our civilization. What is not well known is that buildings are responsible for a large portion of these emissions, accounting for about half of CO2 emissions of anthropogenic origin in the United States (2). This means that to reduce human impact on climate it is necessary to reduce building related anthropogenic warming. This is possible through appropriate low carbon design.This article introduces some of the mechanisms through which a building emits greenhouse gases, the tools that we can use to count these emissions and some strategies to reduce them. A building is directly responsible for the generation of CO2 by its operation, construction, water use, and waste generation (3) and is indirectly responsible for CO2 emissions due to transportation to and from the building.
Operation
Operational energy includes all the energy used to keep the buildings and everything inside it running and is usually the single largest source of building related CO2 emissions. These emissions can originate from energy used directly at the site (such as natural gas) or at the power plant (electricity) to run heating and cooling equipment, lighting and appliances. It is possible to calculate these emissions with energy modeling software or the meter in an existing building, and then multiplying energy consumption by a carbon dioxide conversion factor. There are several methods to determine this factor which varies by region, time of day and season, depending on the cleanliness of the electricity (3). The average value for the United States is0.62 k of CO2 per kWh for electricity (4) and 0.92 k of CO2 per kWh or 5.43 k of CO2 per therm for natural gas.
Energy use in a 214 m2 house, the 2005 US average, was calculated in three of California’s climate regions using energy modeling software (HEED and Design Builder) resulting in 3857 k of CO2 in Santa Monica, 5807 k in Palm Springs and 6050 k in Bishop, for operation only.
Construction
Carbon emissions from construction processes are emitted during the fabrication and transportation of materials to the building and during the construction of the building. These emissions are more difficult to calculate because it is not easy to determine the amount of the different materials, their origin and manufacturing process, and the transportation method and distance from origin to the site.
For this example construction emissions were calculated using buildcarbonneutral, (5) a simple calculator that provides an estimate of 53 metric tons for this building. The life of the building is estimated at 50 years, equivalent to 1061 k per year over the life of the building. If construction components could be recycled or the building had a longer life, then the number per year would be lower.
Water
Water consumed in the building also generates CO2 emissions. The water used in the building must be pumped from the source and treated for human consumption, while the waste water from the building must also be pumped and treated to remove physical, chemical and biological contaminants.
A study on water-related energy use in California (6) calculated the embedded energy in water for southern and northern California. They estimated the amount of energy needed for each sector of the water-use cycle in terms of the number of kilowatt-hours (kWh) needed to collect, extract, convey, treat, and distribute one million gallons (MG) of water, and the number of kWh needed to treat and dispose of the same quantity of wastewater. For Southern California the embedded energy per MG is 13,021 kWh, which means that to provide 552670 liters of water per year to a family of four in Southern California require 1901 kWh. If every kWh of electricity in California generates about 0.32 k of CO2 (3) then the water used by a family of four in Southern California generates about 605 k of C02 / year, equivalent to 0.0034 kg of C02 / L.
Solid Waste
Waste from the building must also be treated. More waste requires more treatment and sometimes generates methane, which is a potent greenhouse gas produced in landfills. Using EPA’s emissions calculator (7) gives 1,856 k of CO2 from waste for a family of four. Many cities and households recycle but recycling is still not mandatory in most parts of the United States. If solid waste recycling was implemented (plastic, aluminum, newspapers, glass, magazines) emissions would be reduced to 1,044 k per household. More recycling would reduce emissions even more.
Transportation
A building’s location affects emissions. Because people must move to and from the building, generating CO2 in varying amounts (bus, train, automobile, walking, bicycle), a building is also indirectly responsible for CO2 emissions from transportation. A location close to public transit lines or in urban areas with higher density and walkable neighborhoods usually reduces transportation emissions. If each household drives a total of 35406 km per year in cars with an efficiency of 9.36 km /L (the national average), the total yearly emissions are 6545 k per household for automobile transportation.
Totals
Adding these emissions indicates that a family of four living in this house would generate 6567 k. of CO2 in the coastal climate of Santa Monica, probably the mildest in the USA, 8517 k in the warmer climate of Palm Desert, and 8760 k in the colder climate of Bishop.
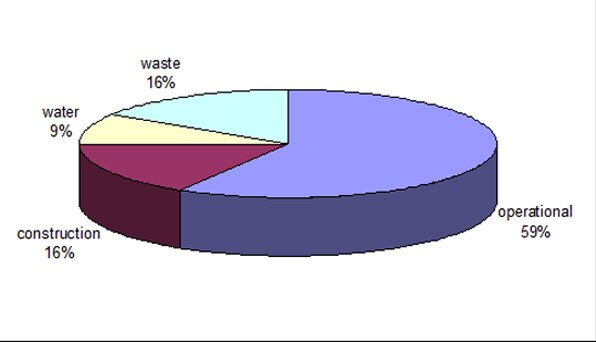
Distribution of CO2 emissions:
Santa Monica
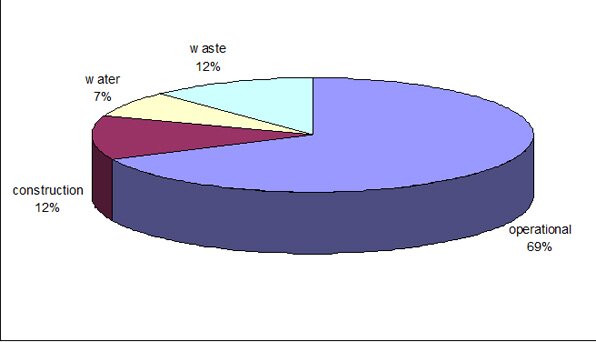
Palm Springs & Bishop
The challenge of designing a truly carbon neutral home is evident. Emissions must be reduced from seven thousand kilograms, or more, per year to zero. Operational energy, which includes heating and cooling has the most impact on emissions and these should be a priority to address with energy efficiency strategies and good old fashioned passive solar. Photovoltaic systems, can also reduce operational emissions by providing clean energy but they still have CO2 embedded in their fabrication. However even though emissions from operational energy are a big chunk of residential emissions (see figure), other strategies that affect emissions such as living close to work, working at home, recycling, reducing water consumption, should be implemented. Designers should learn how to quantify the carbon impact of their design decisions and become used to thinking in units of carbon. To think in these units designers must be able to count with carbon calculators. Several carbon calculators and energy modeling software were compared in the areas previously discussed. These tools were selected with the “free and easy to us”" criteria so that they could be used in the initial phases of the architectural design process, while providing sufficient precision to provide some useful input to the designer. Fifty tools were analyzed, ten of these tools provided no useful information while forty provided useful results in at least one of the areas mentioned. The tools are presented in the following figure and shaded in the area where they can calculate emissions. More detailed information on all of these tools is available in the carbon neutral design project website (8).
Pacala and Socolow in a well known paper (9) suggest that humanity already possesses the fundamental scientific, technical,and industrial know-how to solve the carbon and climate problemfor the next half-century. To keep the focus on technologies that have the potential to produce a material difference by 2054, they divide the stabilization triangle into seven equal “wedges” (now eight), which represent an activity that reduces emissions to the atmosphere that starts at zero today and increases linearly until it accounts for 1 GtC/year of reduced carbon emissions in 50 years. One of these wedges is “efficiency and conservation”, focusing mostly on energy efficiency measures in buildings and transportation. By also implementing strategies in the areas of water, waste, and construction, in addition to energy, we can reduce our impact on climate even more. We must remember that our design decisions will affect the future of our planet.

http://www.princeton.edu/wedges/presentation_resources/Wedges_Figure2_8.jpg
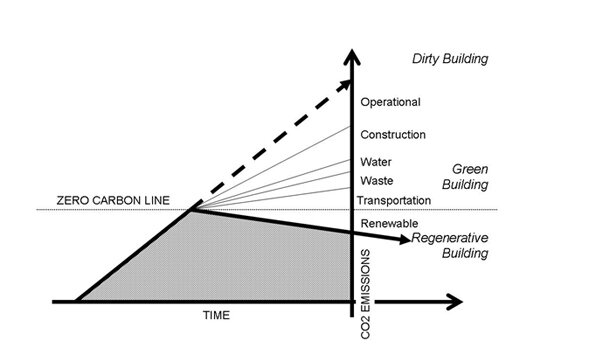
Potential for CO2 reductions in buildings (image by the author)
REFERENCES
(1) Climate Change 2007: Synthesis Report. Summary for Policymakers. An Assessment of the Intergovernmental Panel on Climate Change. IPCC Plenary XXVII (Valencia, Spain, 12-17 November 2007), Fourth Assessment Report.
(2) US Energy Information Agency cited at Architecture 2030 http://www.architecture2030.com/current_situation/building_sector.html (2009)
(3) eGRID2006 Version 2.1 (April 2007) Summary Tables
(4) P. La Roche & C Campanella Carbon Counting in Architecture: A comparison of several tools. American Solar Energy Society National Conference, Buffalo, NY (2009)
(5) http://buildcarbonneutral.org/
(6) Study by the California assembly committee on water, parks and wildlife. http://www.energy.ca.gov/2007publications/CEC-999-2007-008/CEC-999-2007-008.PDF (2009)
(7) personal emissions calculator at http://www.epa.gov/climatechange/emissions/ind_calculator.html (2009)
(8) http://www.architecture.uwaterloo.ca/faculty_projects/terri/carbon-aia/tools3.html
(9) S. Pacala and R. Socolow., Stabilization Wedges: Solving the Climate Problem for the Next 50 Years with Current Technologies, Science 13, August 2004, Vol 305 N 5686 pp 968 - 972
|


 Отправить в ЖЖ